
Distributed tracing
Have you ever wanted to know exactly how your application handled a particular request? You might have been debugging an error or triaging a customer query. It can be extremely difficult to understand all the touchpoints in the journey of a single request, especially in modern, distributed, microservice-based architectures. In particular, the nature of serverless applications means they are typically distributed across multiple services and resources; and even across accounts, clouds, networks and security boundaries.
This is where distributed tracing can help. Tracing is a key element of observability, along with metrics and logs. Tracing is a combination of data and insight. Trace data is the raw material of a trace and can include information about the request itself, the service handling the request and any additional context. Traces can be analysed via tools like trace maps and search functionality to provide insight into the requests flowing through an application.
Tracing can help us to understand performance bottlenecks, identify broken services, and surface logs and metrics to support incident resolution.
Tracing tells the story of an end-to-end request, including everything from mobile performance to database health
Instrumentation
Instrumentation is a term that is often associated with tracing. Instrumentation simply describes the process of converting certain operations in an application into an instrument for measuring application performance, via traces. For instance, Lambda functions can be instrumented to collect data about invocations (this function was invoked, this function experienced a cold-start, and so on). AWS SDK calls can also be instrumented, which essentially involves adding a trace header (like X-Amzn-Trace-Id) to AWS API requests, to trace requests across services.
Instrumentation in AWS can be done with the X-Ray SDK.
The AWS Lambda Powertools for TypeScript library was recently released and can also be used for working with AWS X-Ray.
We will use Powertools for the examples in this post.
Tracing tools
There are many options for collecting tracing data, instrumentation and analysing traces. Choosing the right tools will depend on the application, technology stack and budget.
For this post, our application will be running on AWS, so we will use the native tools available:
- AWS Lambda Powertools (TypeScript) for instrumentation
- AWS X-Ray for collecting tracing data
- AWS CloudWatch ServiceLens for analysing traces
AWS X-Ray also provides a dashboard for analysing trace data. AWS CloudWatch ServiceLens comes with a modern, more intuitive user interface and is slightly better suited to an introduction.
Annotations
Annotations are primarily used to support filtering and grouping of traces. Annotations are added to the segments and sub-segments of a trace. Any annotations found in a trace are then available to apply as a filter when searching through traces.
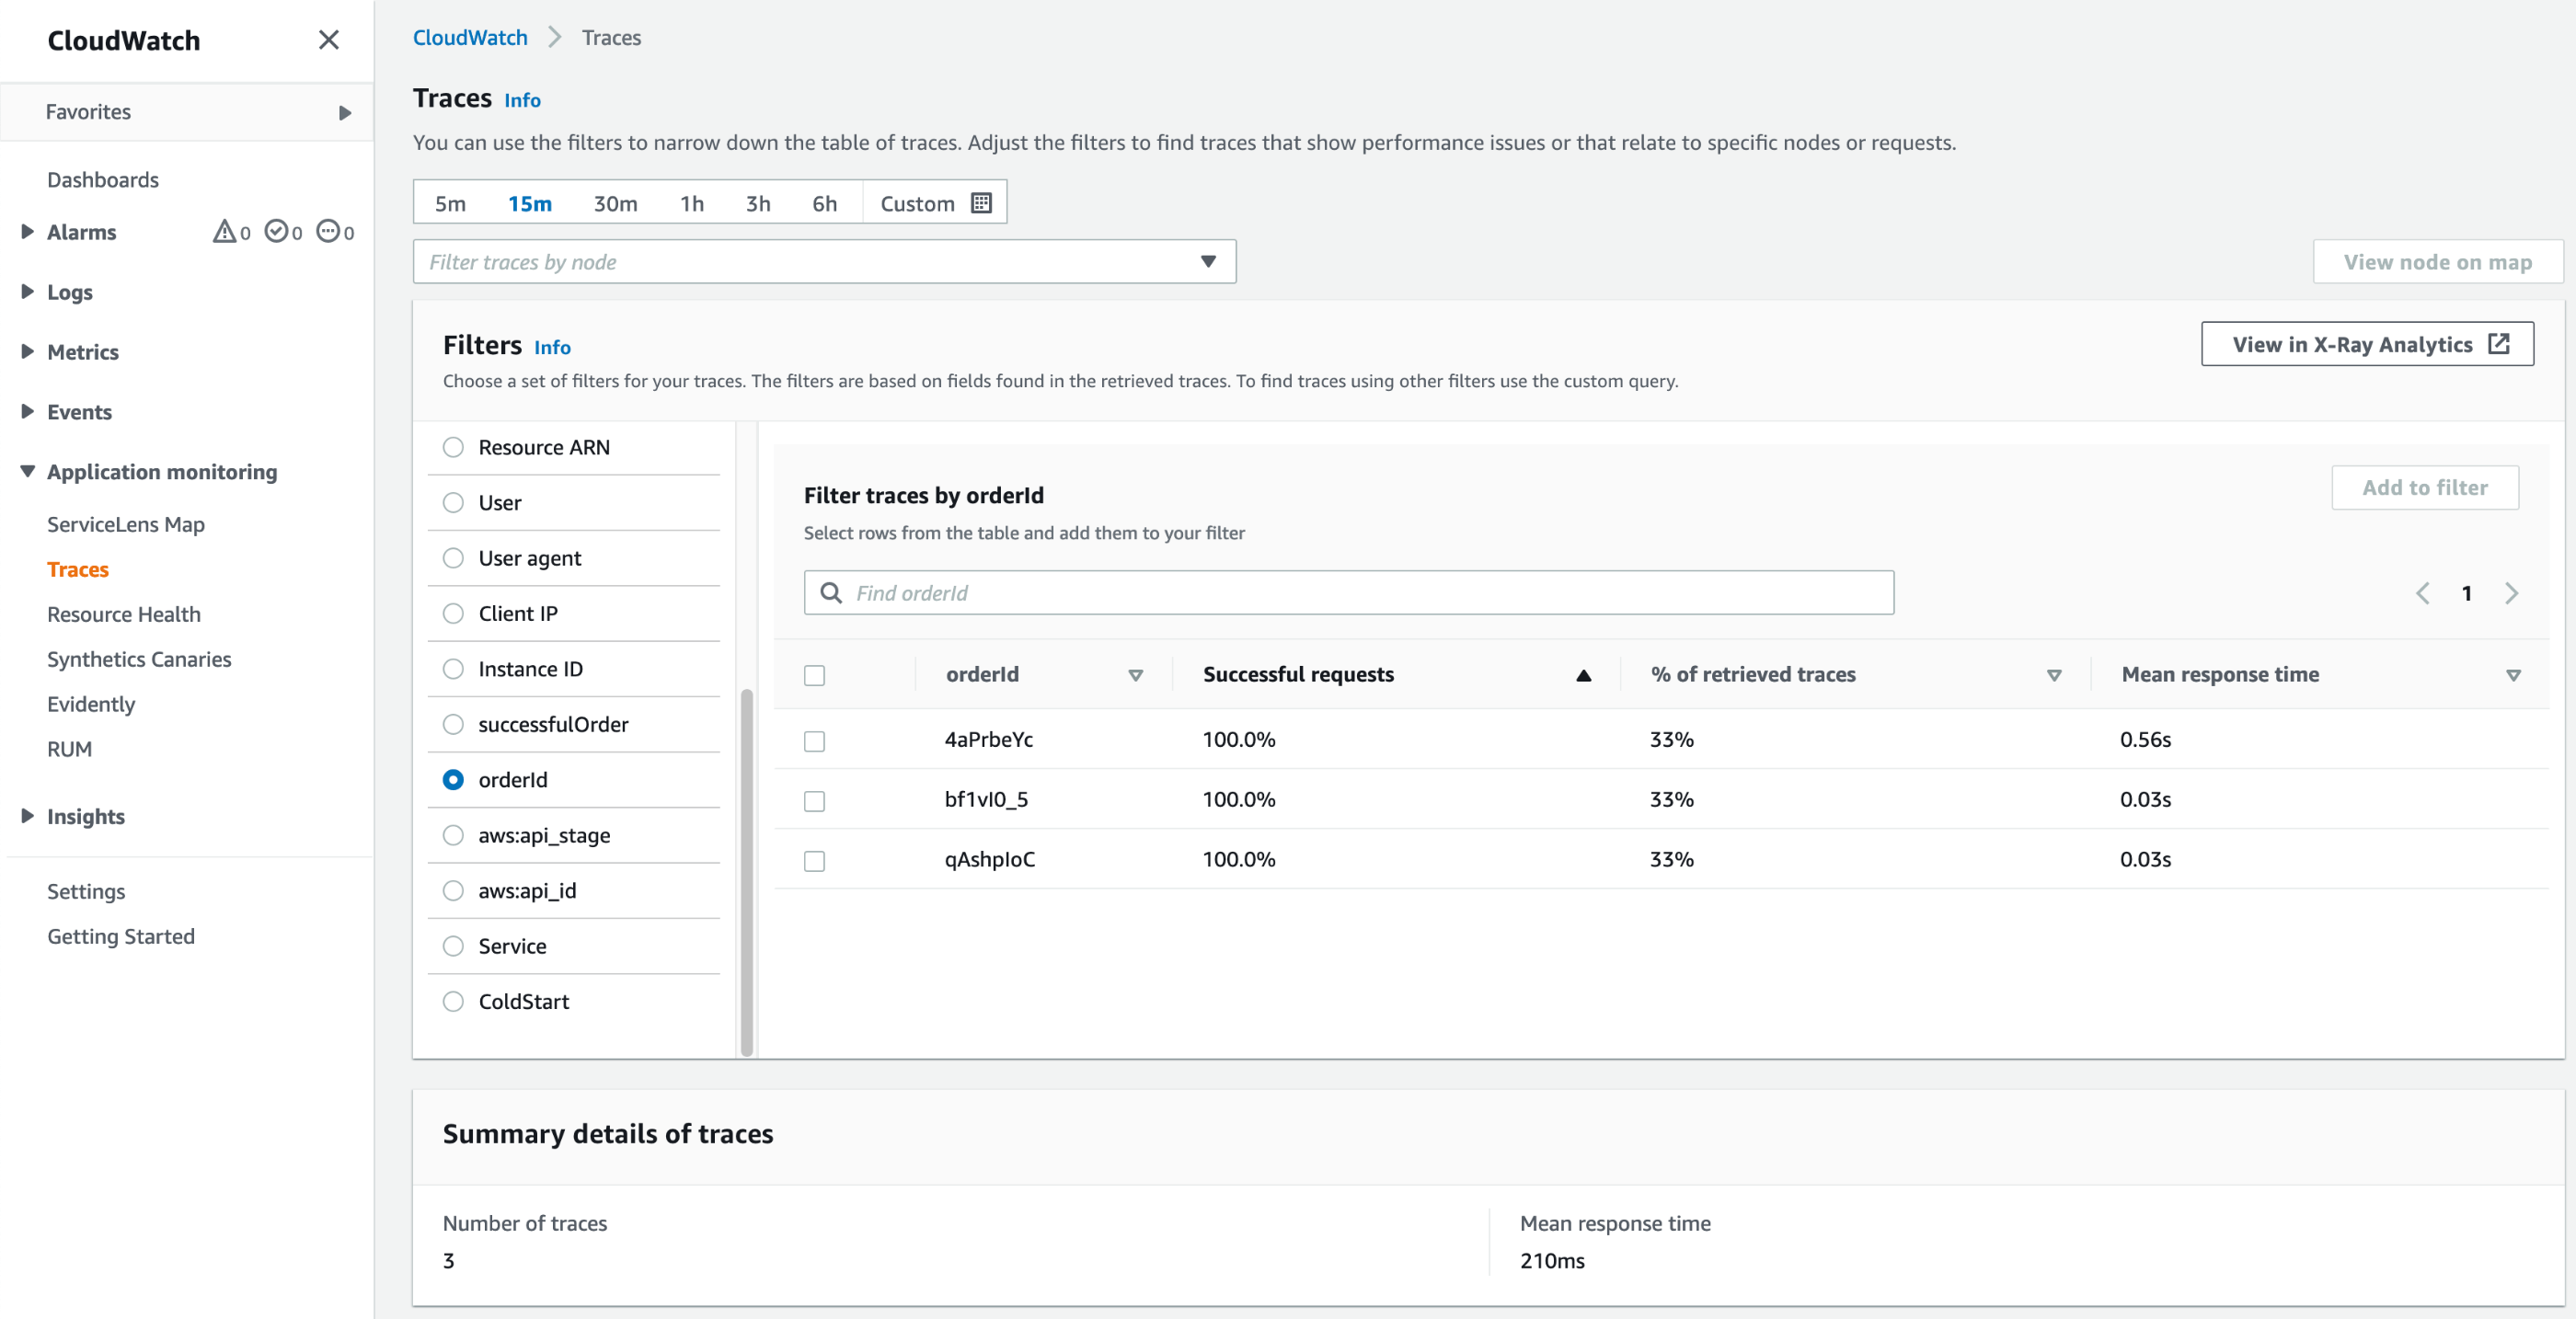
As an example, a trace could be annotated with the result of a particular process, such as:
tracer.putAnnotation("successfulOrder", true);
This annotation would allow us to filter our traces for successful - and unsuccessful - orders.
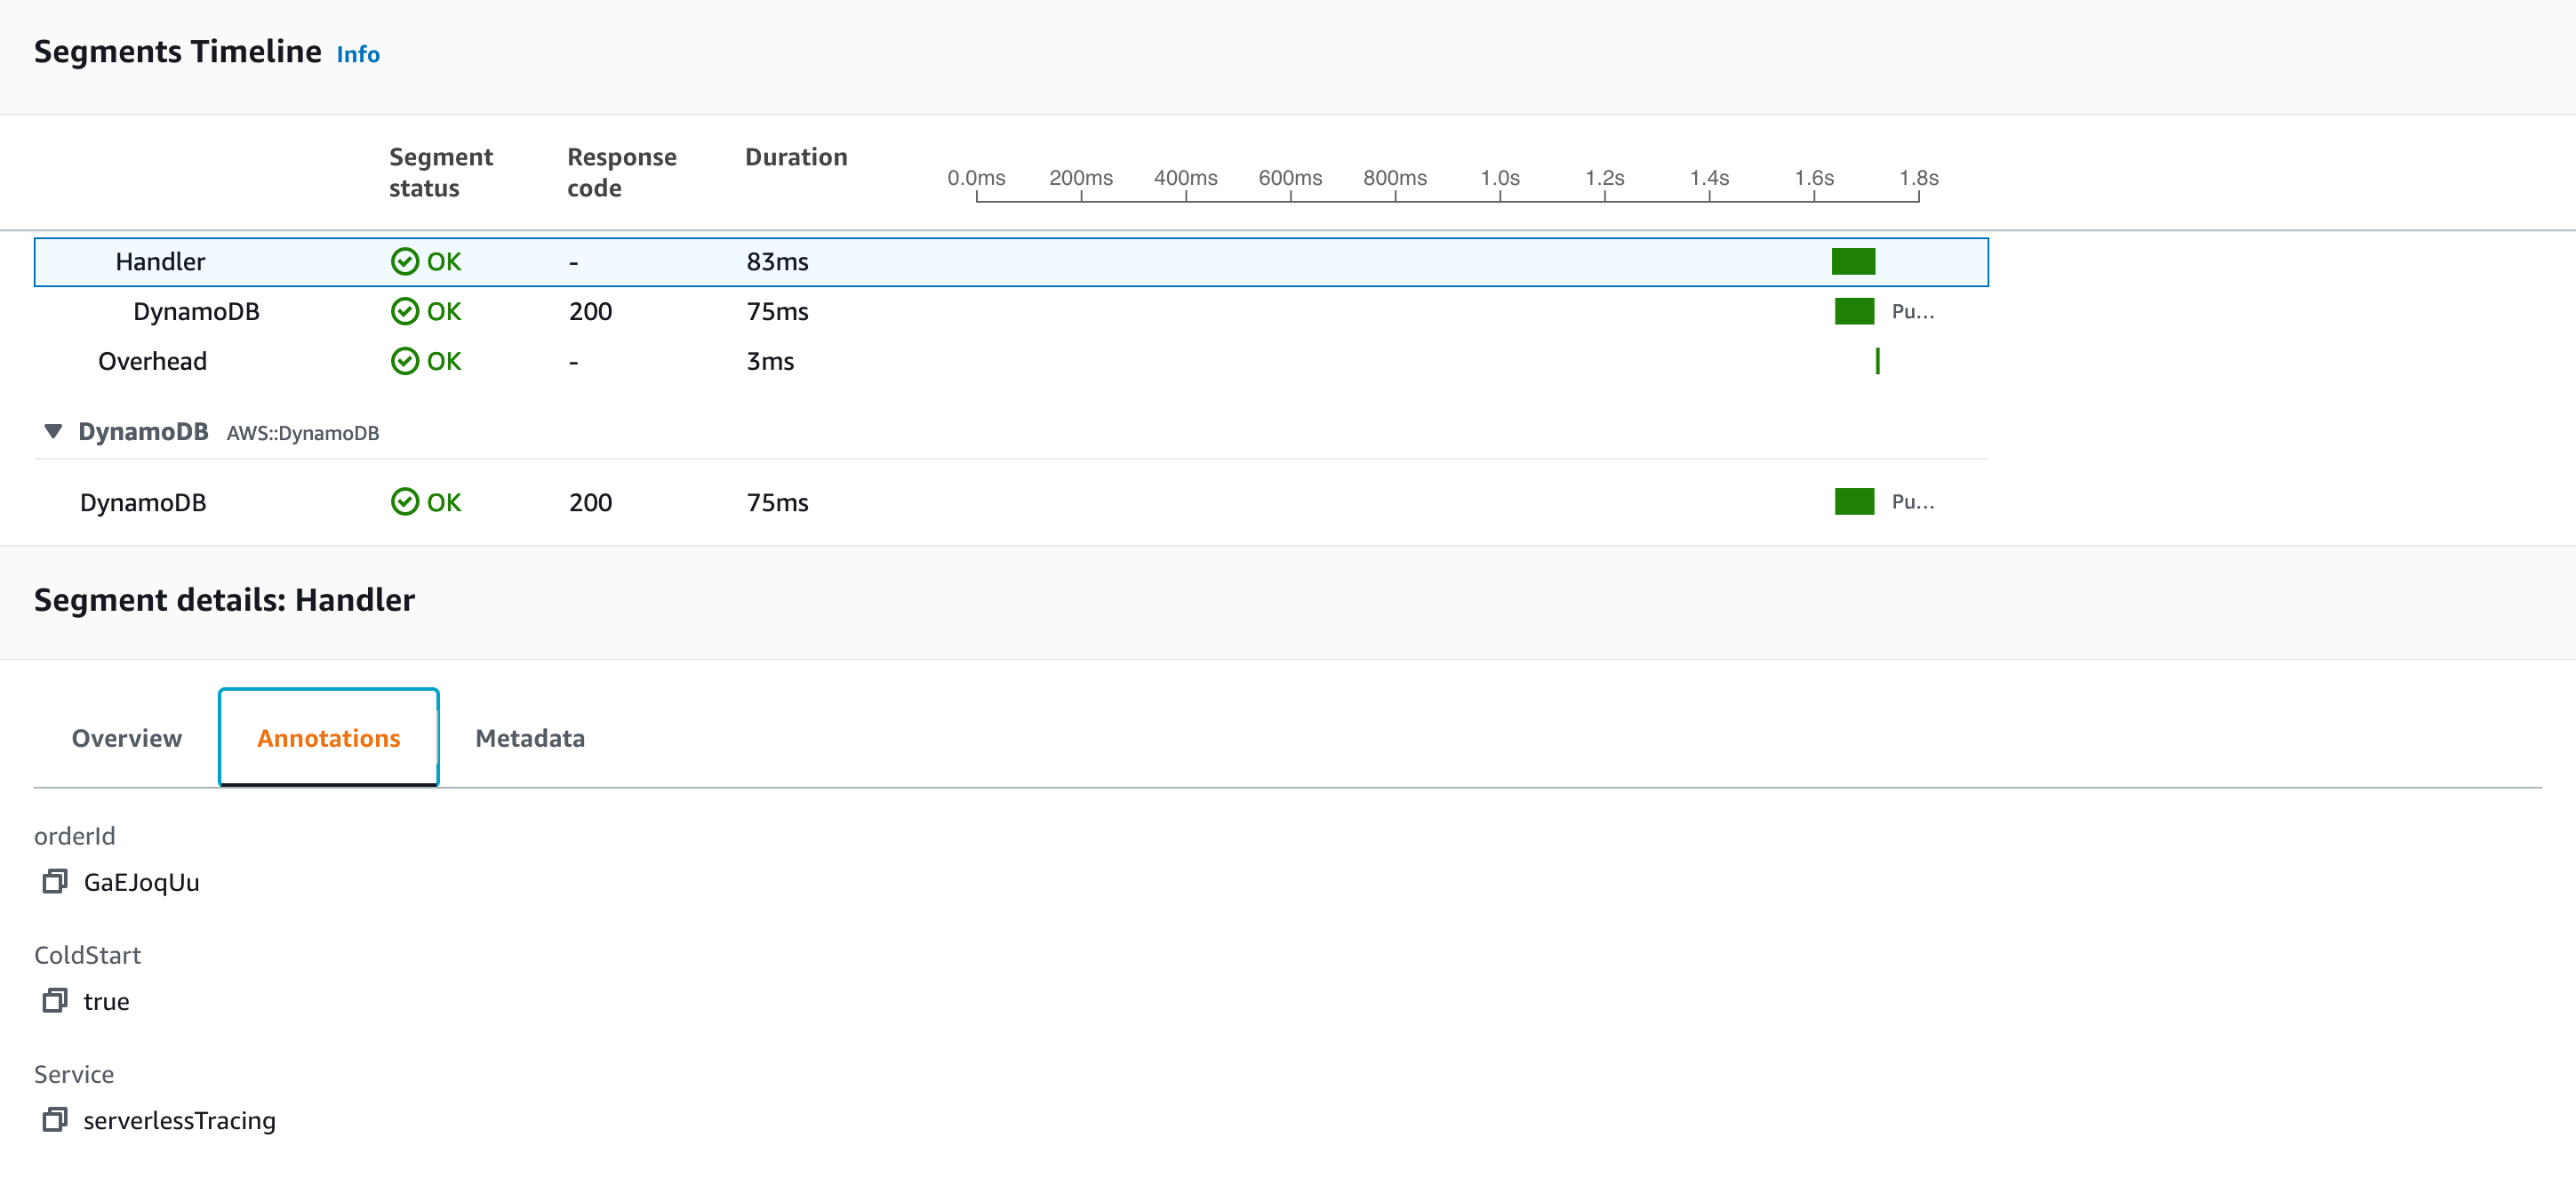
In a Lambda execution environment, each function has a “main” segment by default. This can be seen in the Segments Timeline as the Invocation phase. It is important to note that you cannot annotate the main segment in a Lambda execution environment. Instead, annotations should be added to sub-segments. If you are using Powertools, sub-segments with annotations can be created like this:
const segment = tracer.getSegment();

const handlerSegment = segment.addNewSubsegment("Handler");

tracer.setSegment(handlerSegment);

tracer.putAnnotation("orderId", orderId);
Powertools also has some built-in annotations, for tracking cold starts and service names:
tracer.annotateColdStart();

tracer.addServiceNameAnnotation();
Asynchronous tracing with annotations
Most serverless applications will make asynchronous network calls to 3rd party services. A service will make a request to the 3rd party and the 3rd party will process the request asynchronously. The service will usually receive an acknowledgment from the 3rd party to confirm receipt of a valid request and then a subsequent response a while later, typcially via some form of notification, like a webhook, with the actual result of the request.
It is possible to associate the traces for these operations by annotating both with a consistent value, like orderId. This would effectively allow us to trace across 1st and 3rd party systems and create a complete, end-to-end trace of a single event, such as a customer’s order.
Metadata
Traces can also be enhanced with metadata. Metadata can be added to the segments and subsegments of a trace in the form of key-value pairs.
tracer.putMetadata("orderCreated", { orderId: orderId });
This metadata is then viewable when analysing traces but, unlike annotations, cannot be used to filter or group traces.
It is important to note that, as with annotations, you cannot add metadata to the main segment in a Lambda execution environment. Metadata should be added to sub-segments.
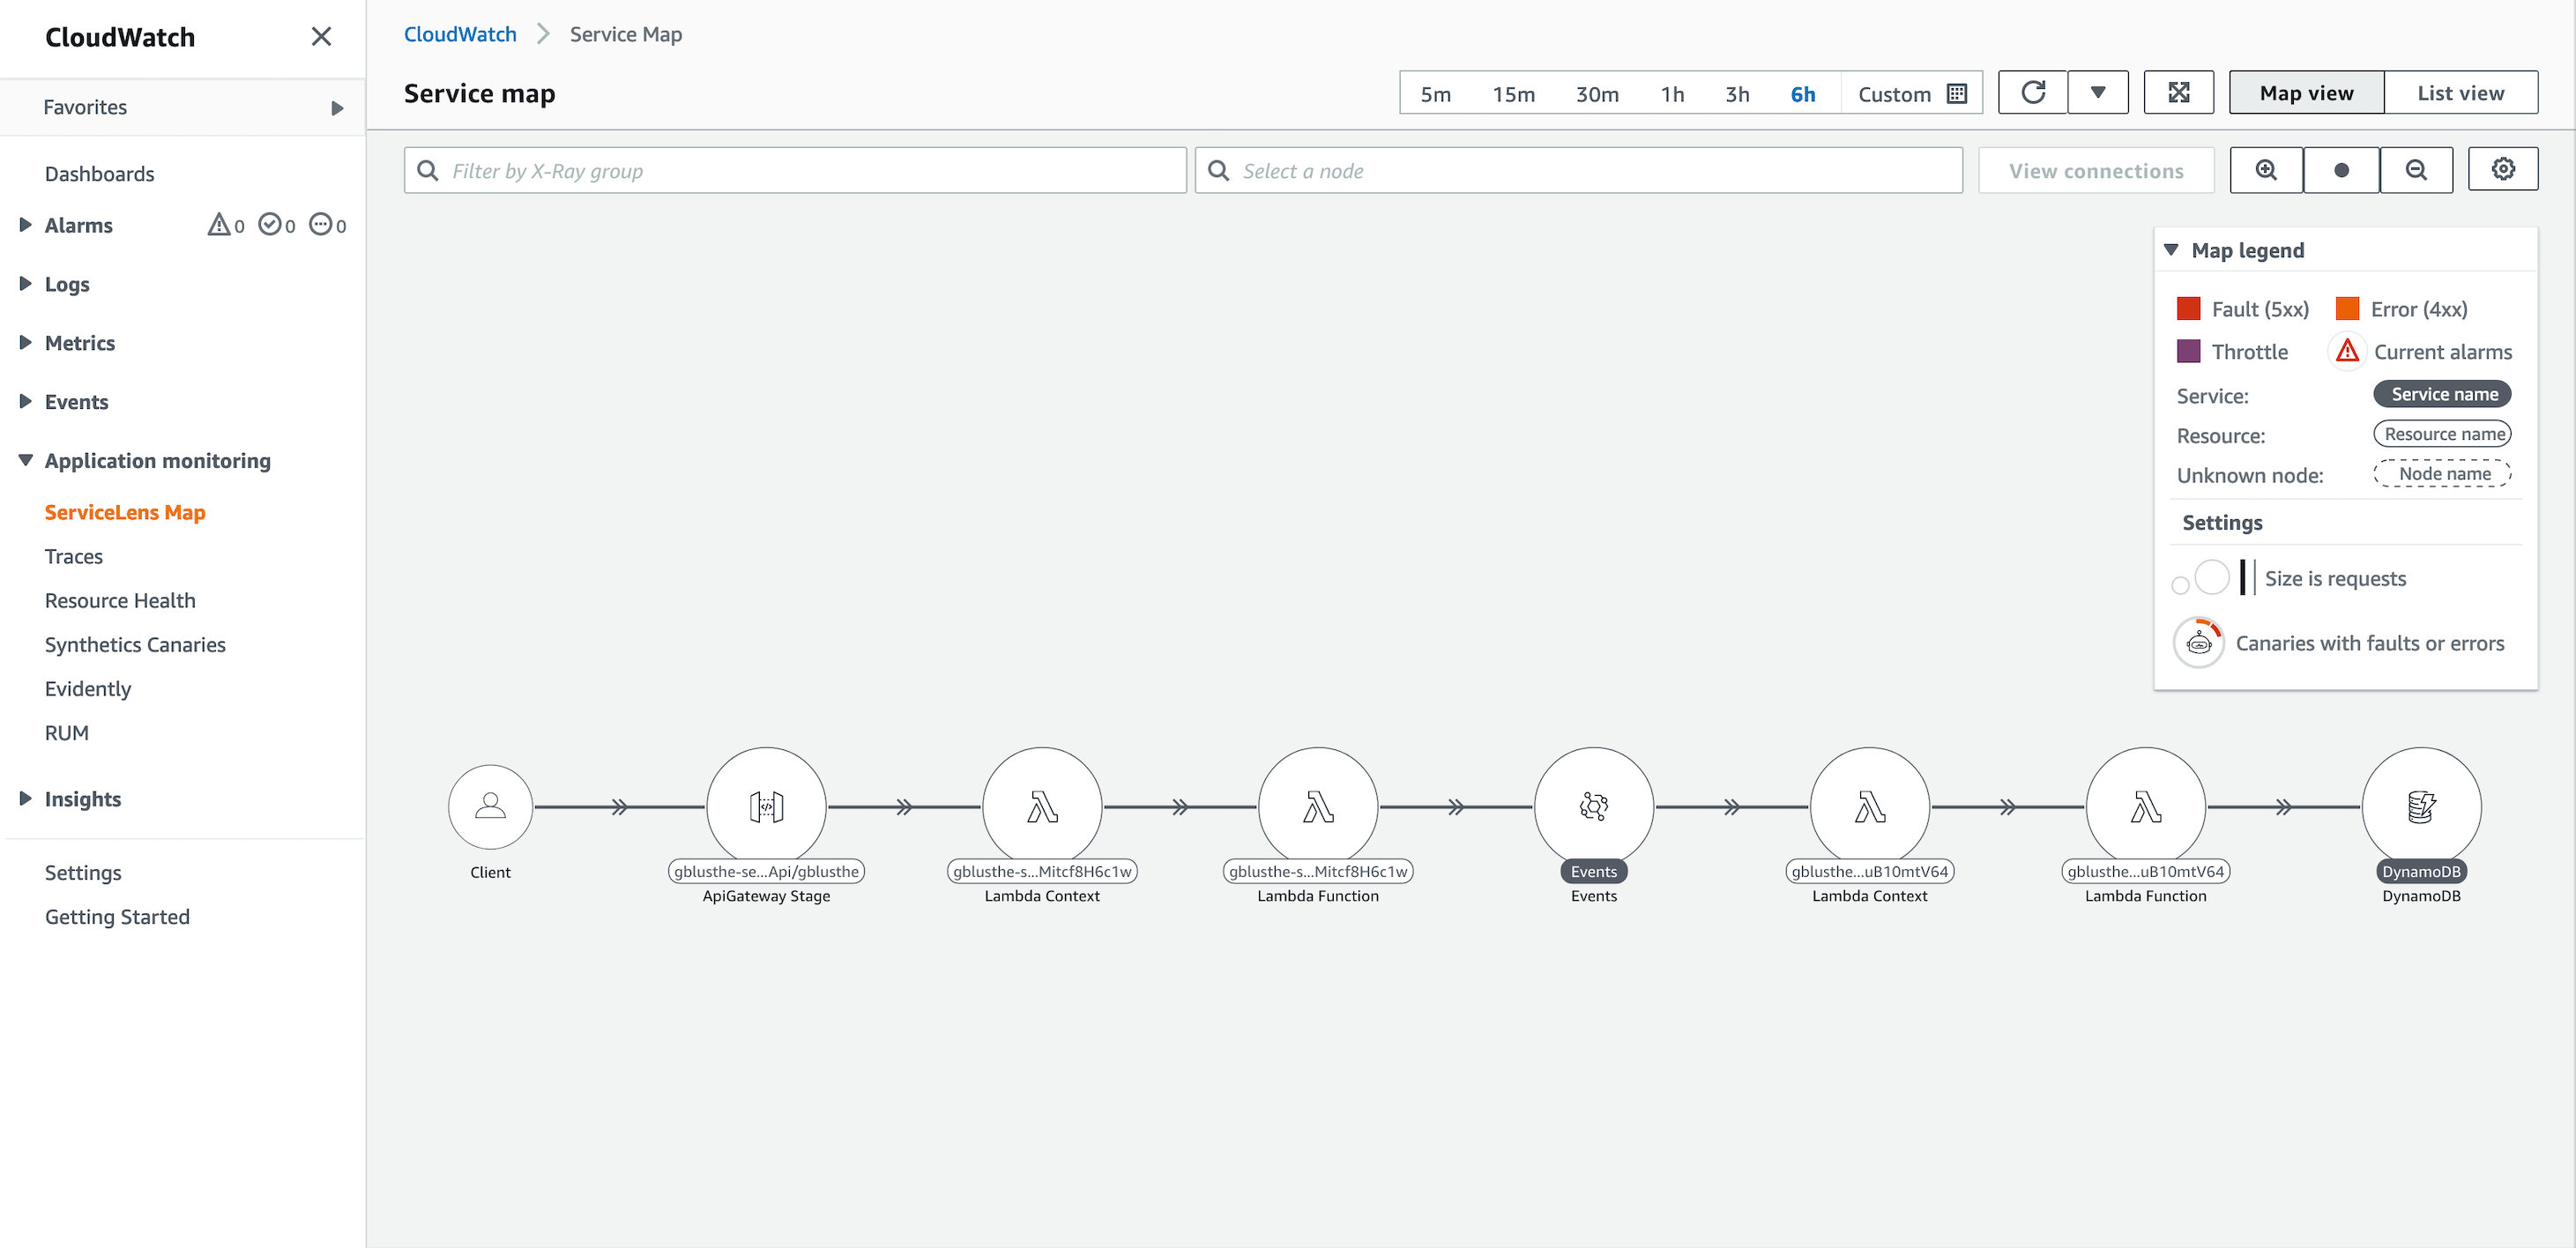
CloudWatch ServiceLens console
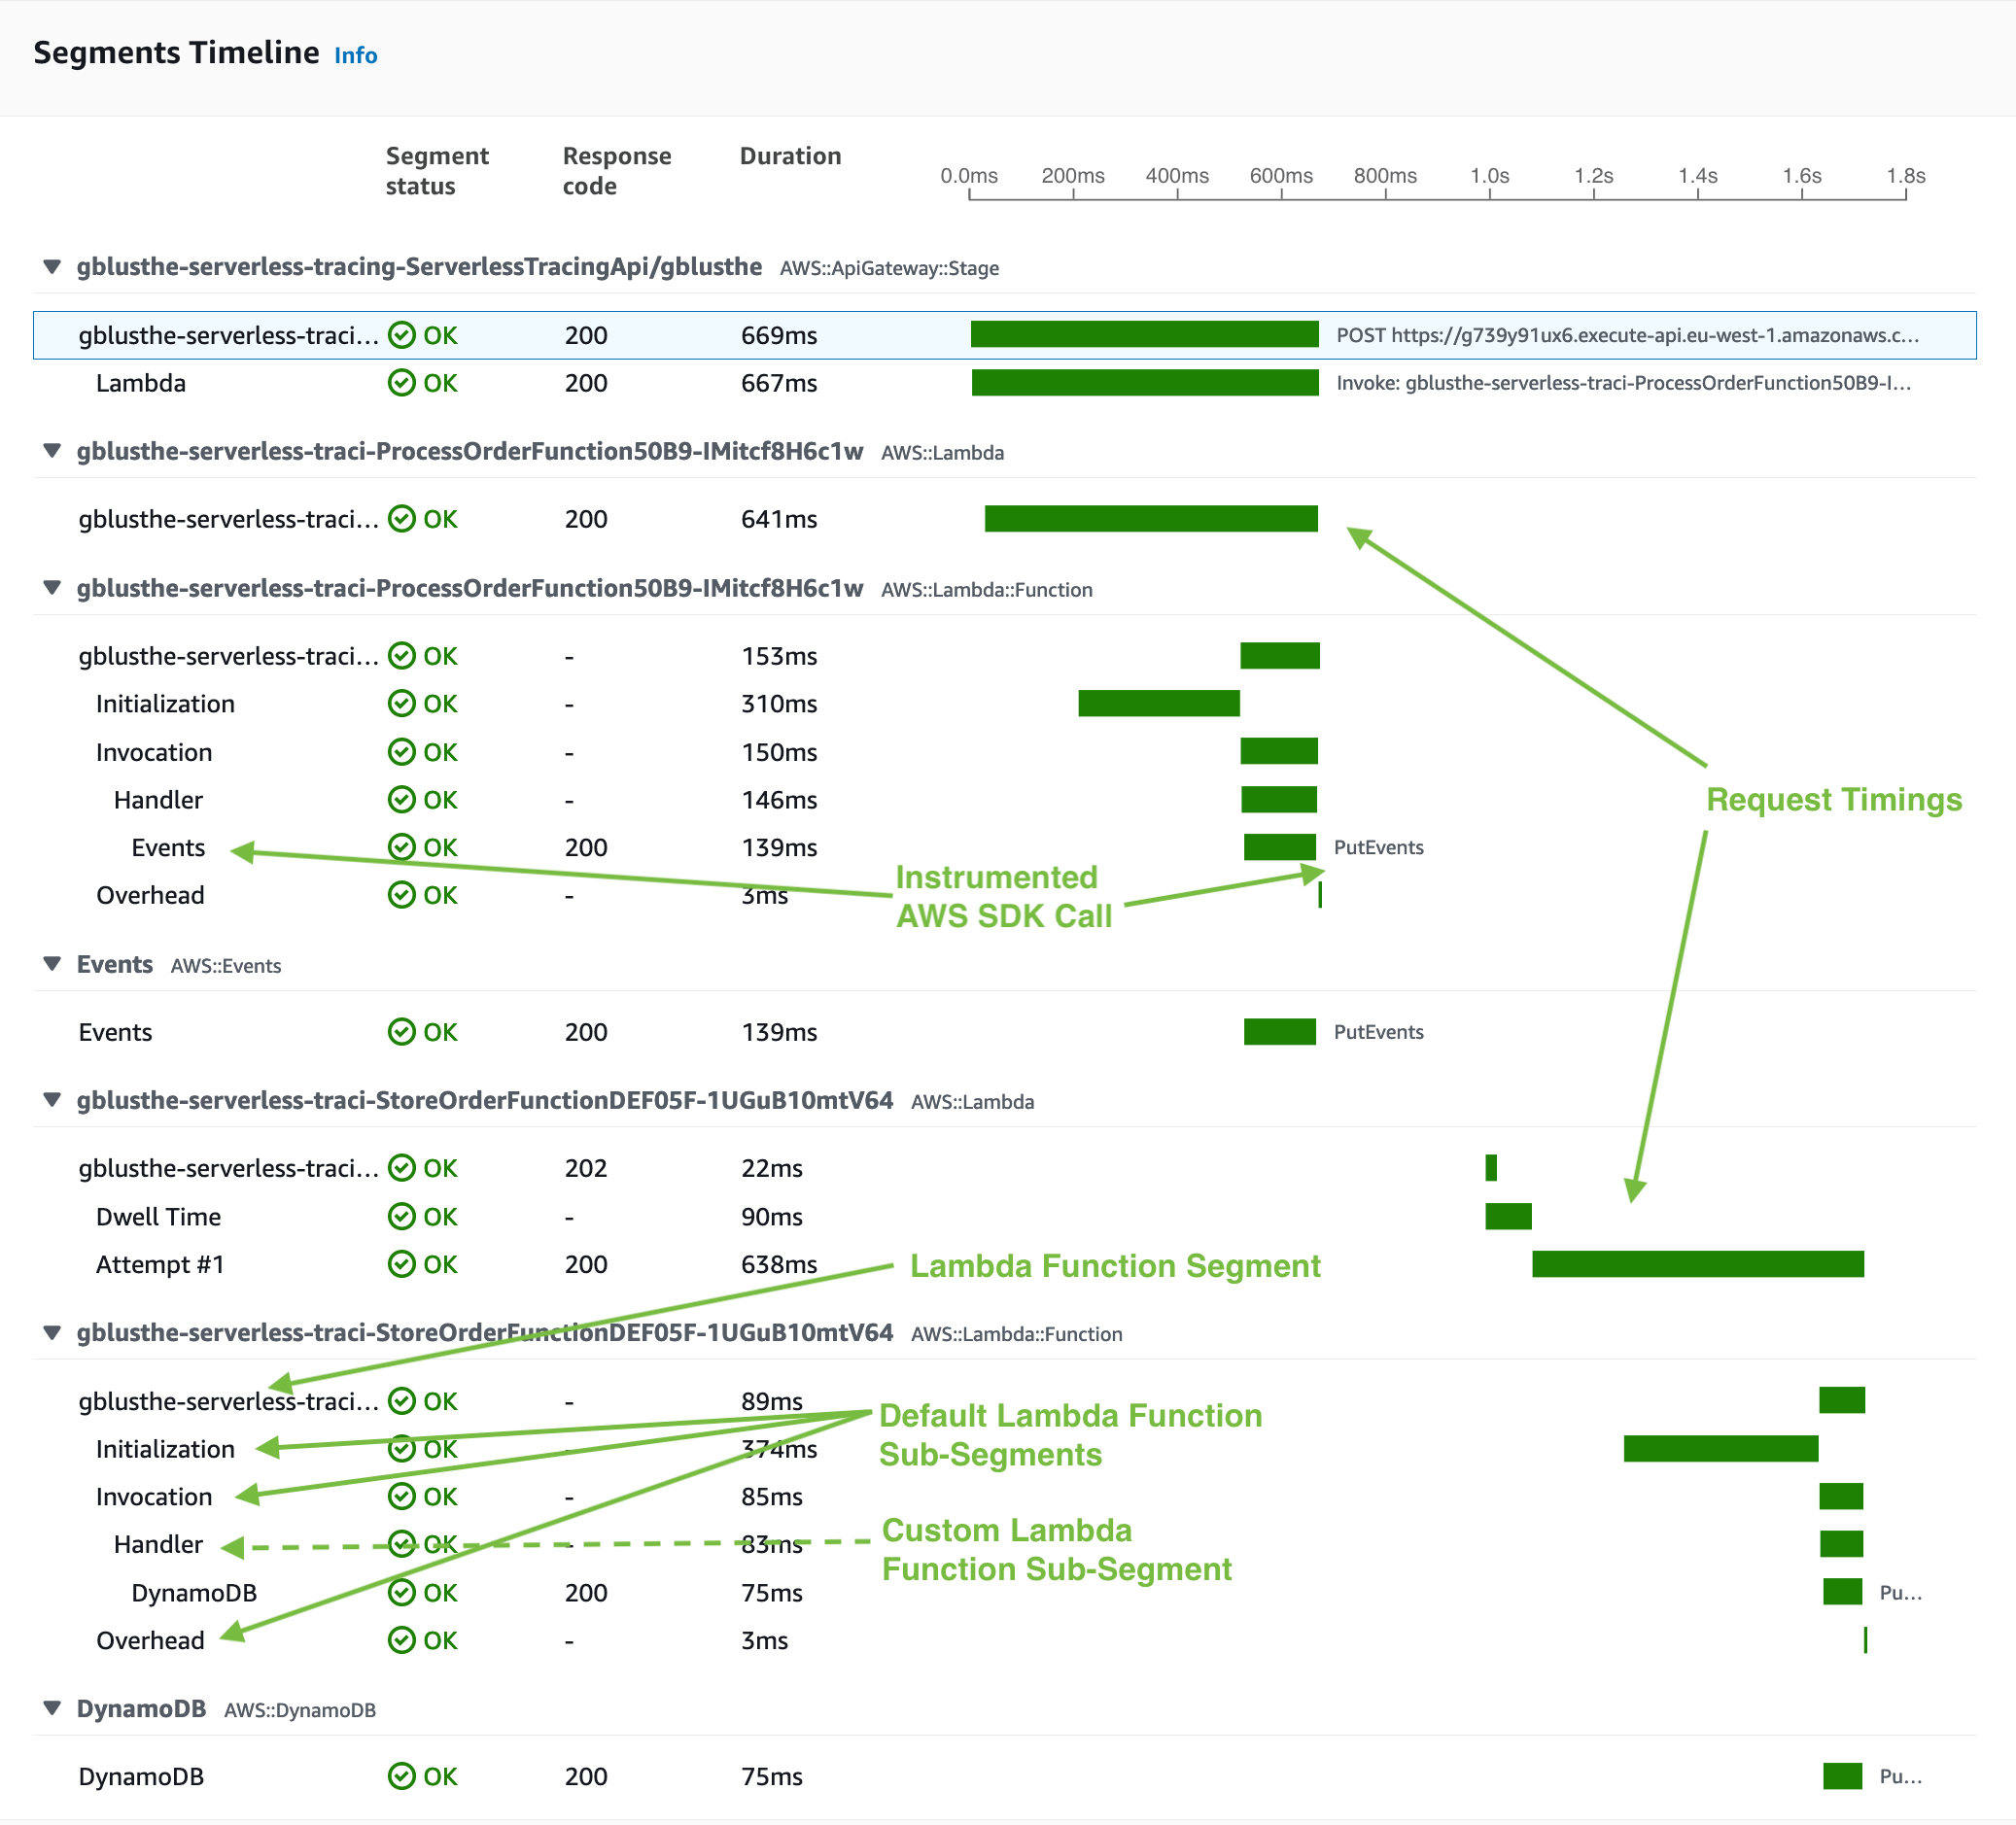
Segments Timeline
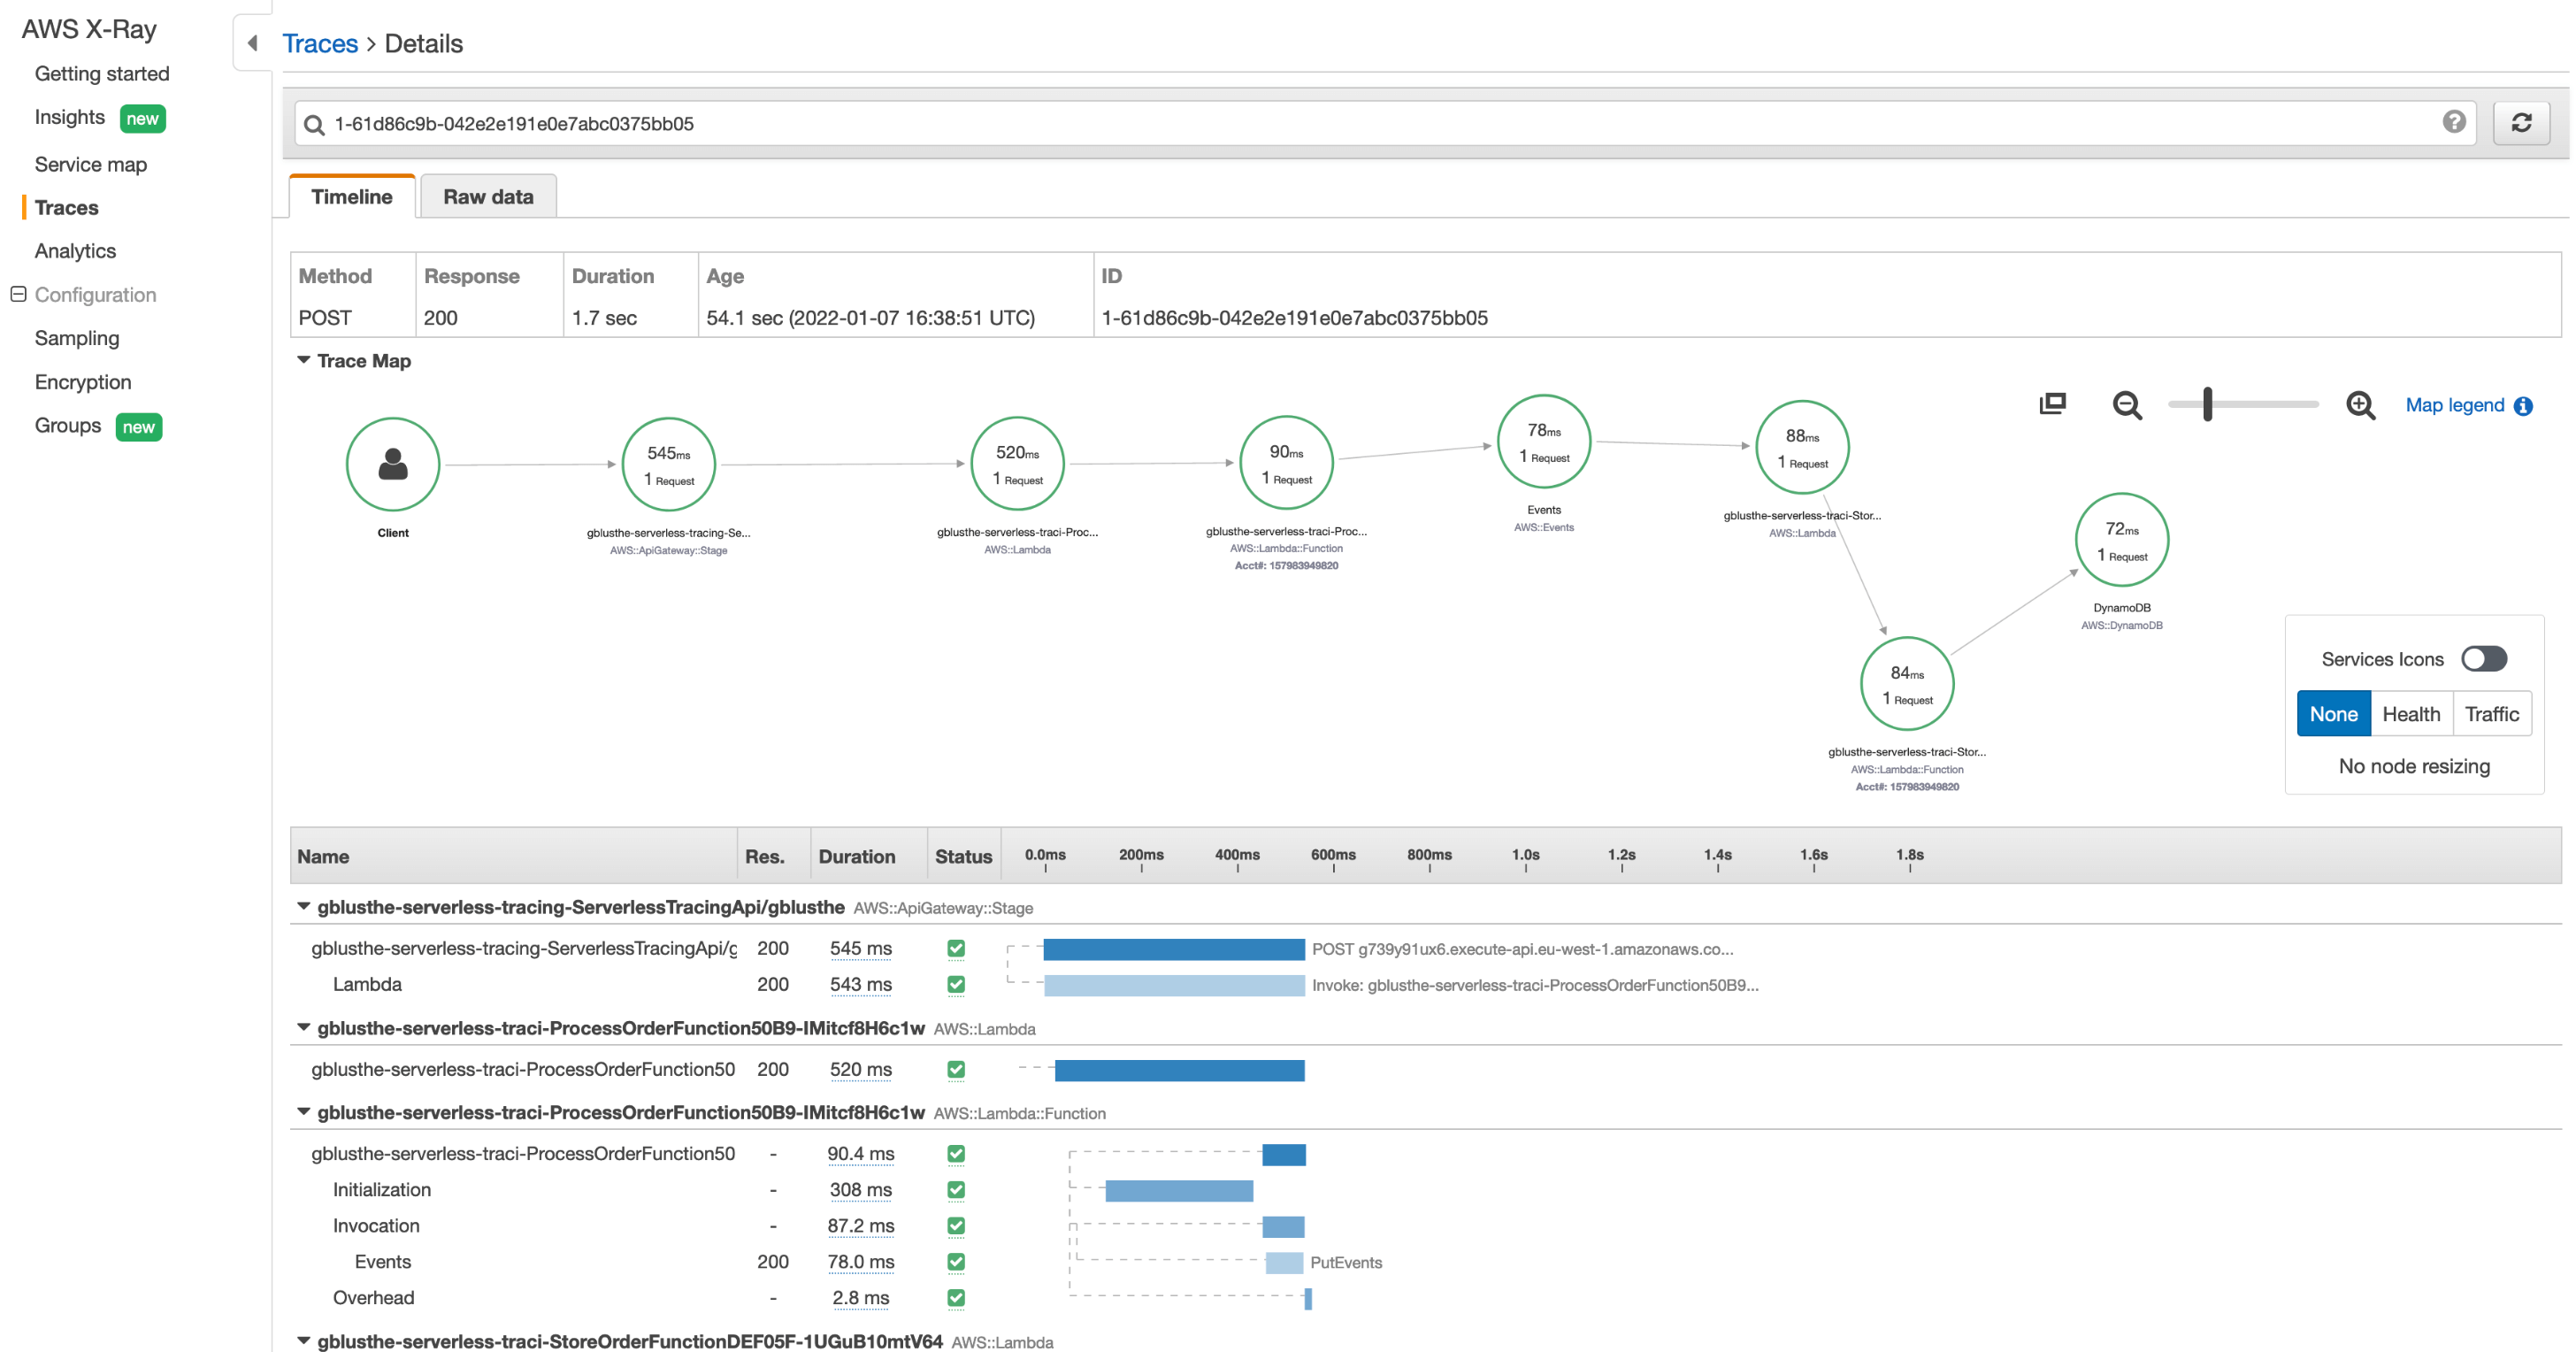
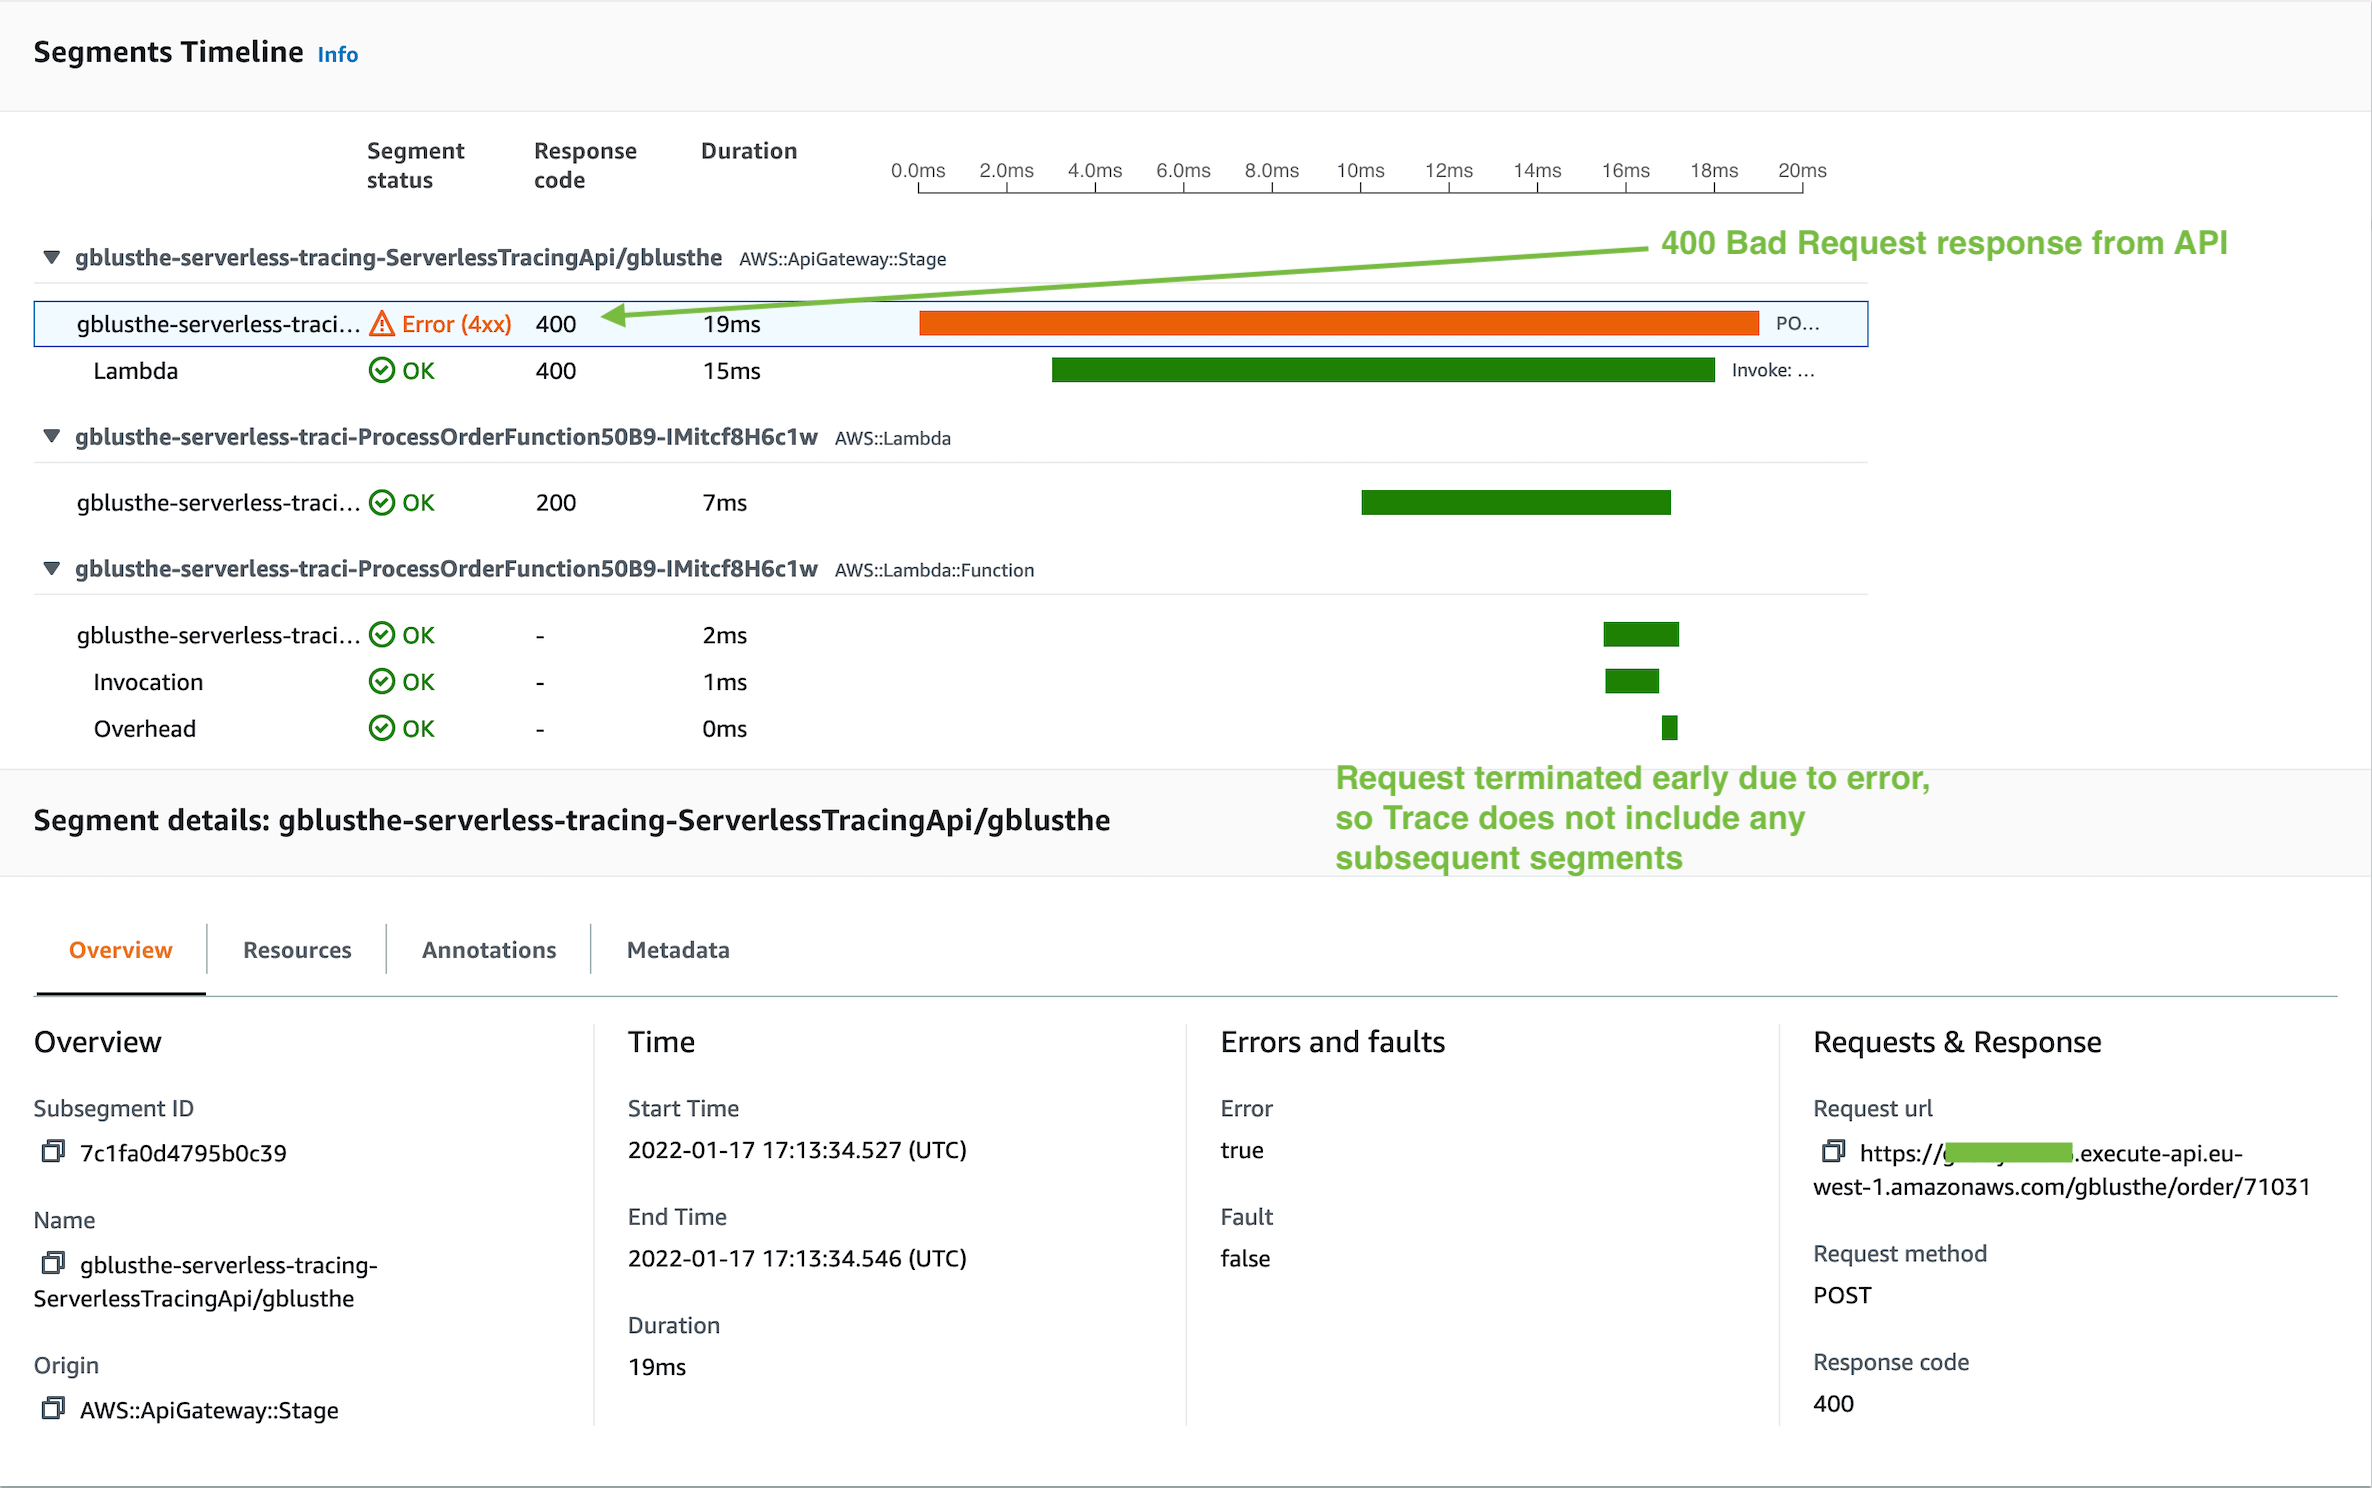
The Segments Timeline displays all of the segments in a single trace, in chronological order with data about the duration of each phase. Usually, each node in a trace map will correspond to a segment in a trace. So, if a request in your application passes through API Gateway and Lambda, you will see a segment for the API request and the function invocation.
A Lambda function segment will include multiple sub-segments. These sub-segments will include any custom sub-segments defined in the function code and a series of default-in sub-segments. The default sub-segments map to phases in the Lambda function lifecycle.
- Initialization - the init phase of a function. This will only be seen on cold-start functions.
- Invocation - the invoke phase of a function.
- Overhead - the phase between function invocations. The runtime will clean-up after the invocation and prepare to freeze the instance.
Any of the segments or sub-segments can be selected to view more information, including annotations and metadata.
Errors
Resources
- Example application - using AWS CDK, X-Ray and Powertools
- Distributed tracing: A complete guide (from Lightstep)